Whether measured in polls, crowds or money raised, Bernie Sanders and Hillary Clinton appear in a tight race as New Hampshire's Primary Day approaches.
Clinton, of course, is no stranger to hard-fought Granite State contests. She edged out Barack Obama in New Hampshire’s 2008 Democratic presidential primary, winning 39 percent of the vote to Obama’s 37 percent.
But the bottom-line vote tallies can obscure a simple fact: The New Hampshire primary is not just a statewide contest.
It's fought town by town, city by city, with candidates investing more resources in some regions than others, looking to rack up votes in one part of the state to compensate for a poor showing elsewhere. A candidate may “win” the New Hampshire primary while also “losing” large portions of the state.
NOTE: If you are using a mobile device, turn phone or tablet sideways to view maps.
Underlying this are some interesting voting patterns and demographic trends that help shape campaign strategy.
Take that earlier 2008 primary race between Clinton and Obama. Here's what the final vote tally looked like geographically, with the towns Clinton won in blue, and Obama's towns in yellow:
2008 Town-Level Wins by Clinton, Obama
(Click on any town to see specific vote margins)
At a glance, the map tells a very clear story: Clinton dominated in the vote-rich cities and towns of southeastern New Hampshire and along the Massachusetts border, as well as chunks of Coos County. Obama, on the other hand, swept the less-populated central and western parts of the state, as well as liberal centers like Durham, Concord and Hanover.

That same general pattern has held in previous Democratic presidential primaries, including the 2004 race in which John Kerry and Howard Dean finished first and second (see map, left).
While Dean won fewer towns (and votes) than Obama, the electoral map was strikingly similar in 2004 and 2008.
In both races, the winner took most of the heavily-populated southeast and pieces of the North Country, while the liberal, "outsider" alternative held the more rural western slice.
But mapping the results in this way misses a big piece of the story. Winning a town is good, of course. But the margin by which a candidate wins can be just as important: Winning Manchester with 51 percent of the vote is a lot different than winning the city with, say, 65 percent.
The map below accounts for that, shading each town according to the number of votes by which a candidate carried it in the 2008 primary. The darker the town, the bigger the candidate’s vote margin. (The colors remain the same as the previous map: blue for Clinton, yellow/orange for Obama.)
2008 Town-Level Margins of Victory for Clinton, Obama
(Click on any town to see specific vote tallies)

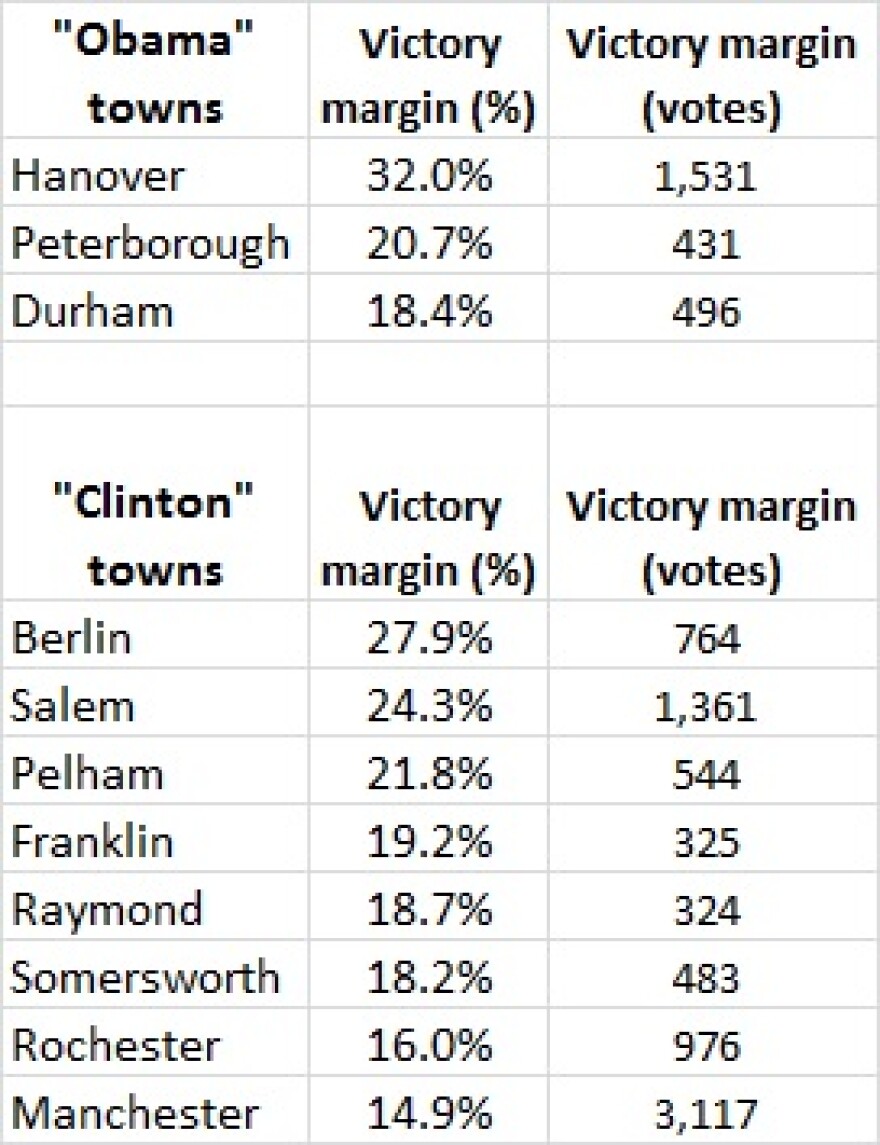
We see that Clinton racked up her biggest margins in former mill cities like Manchester, Nashua, Berlin and Rochester – bastions of blue-collar Democratic voters – as well as a handful of vote-rich towns in the more conservative Southern Tier.
Those blowouts in the state’s major population centers erased whatever geographic advantage Obama had in rural areas and liberal strongholds like Keene, Hanover, Durham and Concord.
In fact, Obama’s margin of victory over Clinton exceeded 500 votes in just two communities: Keene and Hanover. Clinton, on the other hand, enjoyed 500+ vote margins in nine cities and towns, including a more than 3,100 vote majority in Manchester.
In short, there just weren’t enough people in the Obama-leaning towns to counter Clinton’s Southern Tier advantage.
What does this tell us about how the 2016 Democratic primary might turn out?
If past patterns hold, Sanders' base of support will be in western New Hampshire, particularly the towns bordering his home state of Vermont. But he'll have to chip into Clinton's margin in densely populated southeastern New Hampshire if he wants to remain competitive. He'll probably also need to scoop up more votes than Obama did in places like Manchester, which accounted for 40 percent of Clinton's victory margin in 2008.
A look at Clinton's and Sanders' campaign schedules this year provides one way to understand how the candidates are competing geographically in New Hampshire.
Clinton and Sanders 2016 Campaign Stops in New Hampshire
Sanders (orange dots in the above map) has made a handful of visits to Greater Manchester, but he's largely avoided campaigning in the Southern Tier. Rather, he's spent the bulk of his time in the more liberal, pro-Obama towns of the Concord area, the Seacoast and the Connecticut River Valley.
But he likely won't be able to count on those areas alone to push him past Clinton come February.
The numbers behind these maps come from a new election database developed by NHPR that compiles voting results for New Hampshire stretching back to the 1970s, covering every race from president to the State House. We’ll be putting together more maps, graphics and data explainers through the course of the presidential primary and beyond.


