Heading into November, New Hampshire Democrats talked a big game when it came to their hopes for retaking control of the state Senate.
But when the Republicans ended up maintaining the same 14-10 margin they’ve held for the past two years, Democrats placed at least part of the blame for their losses on gerrymandered district lines.
As it turns out, they might have a point.
It can be hard to quantify just how much of a role redistricting really plays in any given state election. Individual races are also shaped by the policy debates of the day, the tailwinds of national politics and, obviously, the candidates themselves.

But there is at least one way to look at how much of a partisan advantage is baked into a given map: It’s called "The Efficiency Gap."
"That single number tells us how severe the gerrymander is, and who's benefited and who's hurt by it," says its creator, Nicholas Stephanopolous, an attorney and redistricting expert at the University of Chicago.
Earlier this year, NHPR used the "efficiency gap" method to gauge the effect of redistricting on state Senate races for the past 30 years. Here's how it works, as we explained at the time:
“The metric hinges on what researchers call ‘wasted votes.’ A vote is wasted if it had no impact on the outcome of a given election. So, any vote for a winning candidate that’s in excess of the number needed to win that race is counted as wasted, since the candidate didn't need it to secure victory. And any vote for a losing candidate is also considered wasted, since it had no impact on the result. Some number of wasted votes are inevitable in any contested election. In a truly neutral legislative map, Republicans and Democrats will have roughly the same amount of wasted votes...
...So, if you count up each party’s wasted votes and divide that figure by the total number of votes cast, that number is the ‘efficiency gap.’ It tells you how much of a disproportionate boost a party got in an election. What that number measures: How much larger a share of seats did a party receive, above what it would have gotten from a neutral legislative map?”
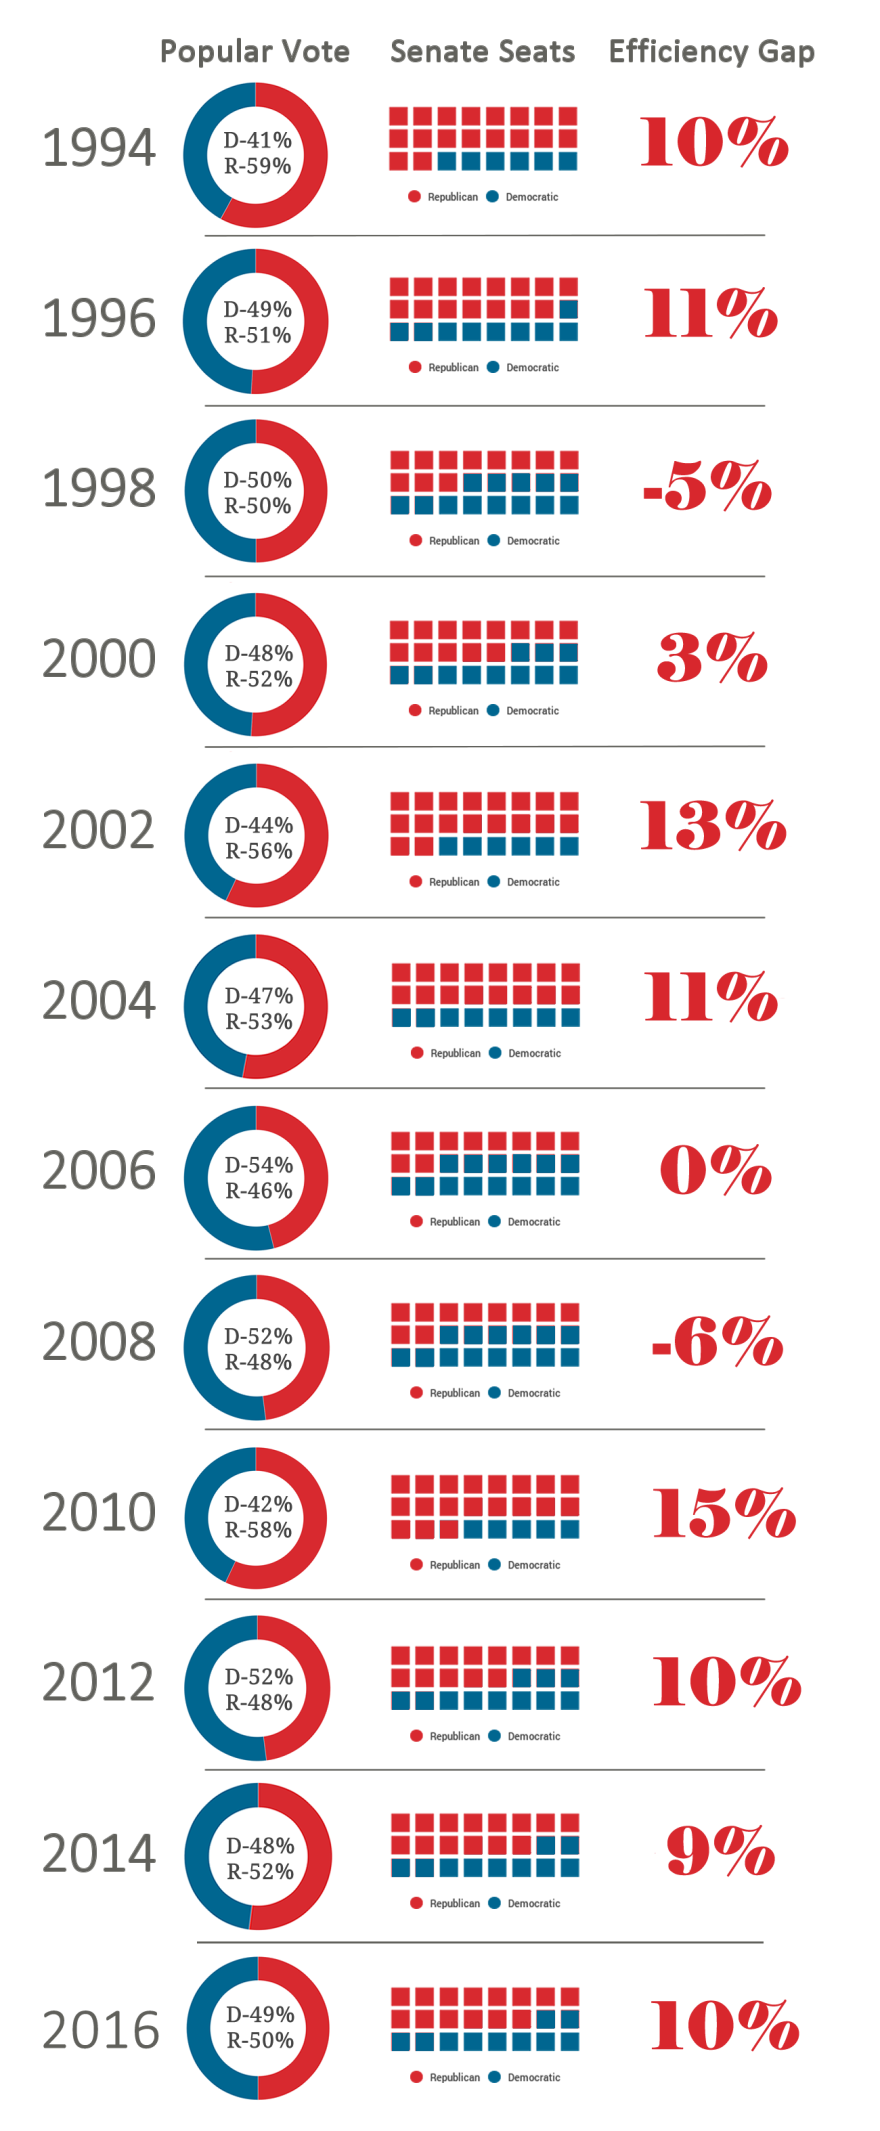
Using this "efficiency gap" formula, we found that the New Hampshire state Senate map has, with a few exceptions, consistently given a boost to Republicans in recent election cycles. This year, based on the results from November’s state Senate elections, that trend seems to have continued.
(Read more: How a Few Lines on a Map Hold So Much Power in N.H. Politics / As New Hampshire Shifts to a Swing State, Why Do Legislative Lines Still Favor Republicans?)

When it comes to the overall popular vote in 2016 across New Hampshire's 24 state Senate races, the partisan split tilted just barely to the right: Republicans picked up 50.4 percent to Democrats’ 49.6 percent of the roughly 689,000 votes cast for the two major parties. (Only about 870 votes went to third-party or write-in candidates statewide, and nowhere were those scattered votes enough to swing any of the individual races.)
When you account for how the overall votes were spread out across all of the Senate district races, Democrats ended up with about 207,000 “wasted votes,” while Republicans had about 137,500. Based on those figures, Republicans ended up with a 10 percent advantage in the number of state Senate seats they picked up, compared to what they might've won if the race aligned more closely with the popular vote.
Put another way: Republicans picked up two more seats than they likely would have if the districts were more evenly competitive across the board. So if the state Senate map were truly neutral, we might’ve ended up with a perfectly divided state senate: 12 seats for Republicans and 12 for Democrats.
And when you consider the added boost that this year's map offered to Republicans, it's also important to remember that they were in charge of drawing that map during the last round of redistricting — a perk afforded to whichever party's in power at the time.
Redistricting takes place every 10 years, in conjunction with the release of new Census data, so the next opportunity to reassess the state Senate map won’t happen again until 2020.
In the meantime, some have tried to push for an alternative to the current process: Instead of allowing the party in power to take the lead in drawing the map, a process that naturally works in that party’s favor, this would give that power to an “independent redistricting commission.”
At least a dozen other states already delegate primary political-map-drawing responsibilities to independent commissions, while some others give these boards at least an “advisory” role in the redistricting process.
This year, lawmakers are on track to consider whether to put an independent redistricting commission in charge here in New Hampshire – but it won’t be the first time. Two proposals to create such a commission already went before the Legislature last year: One was rejected by the House, the other was tabled by the senate.
In the state Senate, the vote fell perfectly among party lines: Democrats wanted to get lawmakers out of the redistricting business; Republicans didn’t want to hand over the pen.
Looking at this year’s outcome, it’s not hard to understand why.
How Many Votes Are Going to Waste in New Hampshire?*

Note: To account for uncontested races (i.e. those in which one party did not field a candidate) we allocated percentages based on the party vote in that district from the most recent presidential election, as a stand-in for partisan break-down. In other words, in a district where no Democrat appeared on the ballot, and the Republican candidate thus received close to 100 percent of the vote, we gave each party the same vote share as it received in the most recent presidential election. Political scientists who study gerrymandering recommend this approach to account for the potentially distorting impact of uncontested races.


